

Part 1 - Energy Performance Monitoring - Introduction
Part 2 - Energy Performance Monitoring - P2 - Monitoring System
******************
Deploy and apply Monitoring results in optimizing Energy use
The example below describes how to deploy, operate and optimize energy usage calculations using wireless sensor technology at a typical data center - Data Center. Due to the outstanding characteristics of the data center's cooling system operation and electrical energy use, Temperature, humidity, and pressure sensors have been installed.
General analysis of sample characteristics Operation
The energy used by the nation's servers and data centers is enormous and growing. It is estimated that this sector consumed about 61 billion kilowatt hours (kWh) in 2006 (1.5% of total U.S. electricity consumption) at a total electricity cost of about $4.5 billion (Greenberg 2006). .
Data centers can use up to 40 times more energy than conventional office buildings, meaning large data centers consume almost as much energy as industrial facilities rather than large buildings. commercial house.
Data center equipment typically has high power density with all electrical energy converted to heat. A recent survey of energy use in more than 20 data centers found that data center IT equipment alone can use approximately 10 to nearly 100 Watts per square foot of raised floor area (Greenberg 2006, LBNL) but only about half of the capacity recorded in the data center is used by IT equipment. The remainder is used for switching power, backup power, and cooling. Peak power usage for data centers can range from tens of kilowatts (kW) for a small facility to tens of megawatts (MW) for the largest data centers.
The growing demand for Information Technology and the exponential growth of digital storage may lead to a situation where companies are forced to build new data centers, not because they are running out. floor space because they need power and cooling capacity beyond what can be accommodated in their existing data centers. This situation has driven much of the recent interest in improving energy efficiency for data centers. If the amount of electricity consumed (and resulting heat generated) in data centers can be reduced through energy-saving measures, existing infrastructure can continue to meet cooling and demand needs. energy needs, while also being able to hold back on costly investments in new data centers. (Andrew Fanara 2007)
Deployment Sequence:
Phase I – Preparation: Perform a site survey and evaluate installation requirements including node locations, special hardware requirements, network configuration, port locations, etc. Then create an installation plan Place sensor layouts using a realistic data center layout.
Phase II – Installation: Install the sensor equipment as previously agreed, set up the Wireless Network and ensure the system is fully functional and records sensor points. Installation processes and times will vary for each type of data center based on their size and any special installation requirements. During installation, data center representatives will also be trained on how to use the Data Center Console.
Phase III – Consulting: Provides on-site support and answers questions as well as evaluates system performance.
Phase IV – Data Collection & Analysis: The dashboard collects sensor point information over a four-week period. This information was analyzed and a summary report was produced with potential energy saving recommendations. This analysis will be presented and reviewed by the center 's Energy Efficiency Planning Officer and staff, information technology executives, and facilities management.
Phase V - Final Evaluation: Subsequent meetings with the Center's Energy Expert will be held to evaluate project performance and review recommendations.

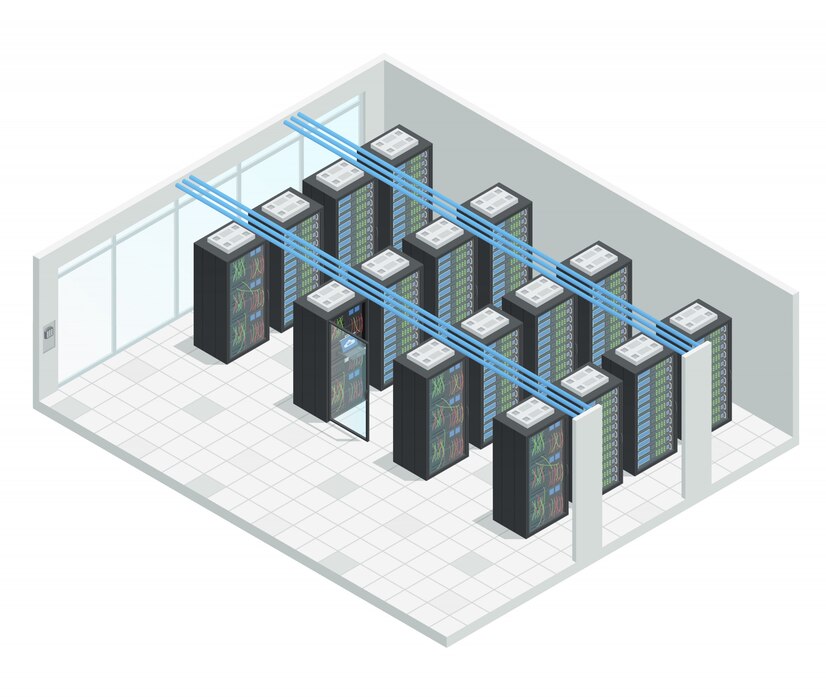
Illustration of sensor installation locations at Top, bottom, middle and under the rack floor
Sample installation location at a data center of nearly 5000 m2 with about 400 sensors as follows: Temperature and humidity sensor for air conditioners (CRAC) in the room Server, Temperature and humidity sensor Moisture placed at the top, middle, and bottom of the main rack cabinet; Temperature and humidity sensors are located in the hallway and additional sensors measure pressure difference and vibration.
Process Monitoring, Supervision and Consulting
Wireless sensor network devices will sample environmental conditions according to the configured frequency (can choose a minimum time of 5 seconds/transmission), with a configuration of 5 minutes/transmission and 400 sensors and systems. Can perform about 1,800,000 measurements in 1 month, thereby collecting nearly 90,000 vital signs every day, serving as the basis for statistical algorithms and data analysis .
The created AI software enables the development of baseline energy assessments, energy metrics, and improvement recommendations for the data center to achieve additional energy savings. The calculation also shows results such as cooling capacity, consumption capacity, heat consumption map, heat dispersion chart in the air...
Total cooling capacity formula = Total installed cooling capacity x Ton to kW conversion factor (3.517)
 For example, the calculation result gives the parameter Total cooling capacity
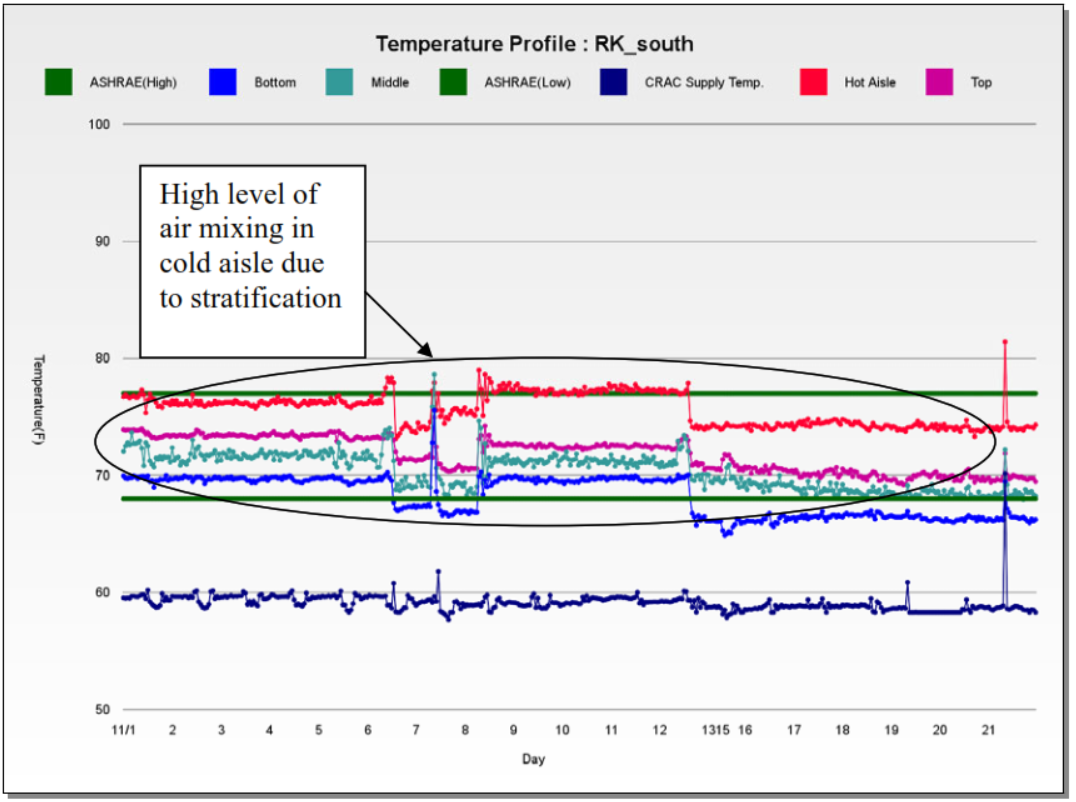
Real-time heat map analysis
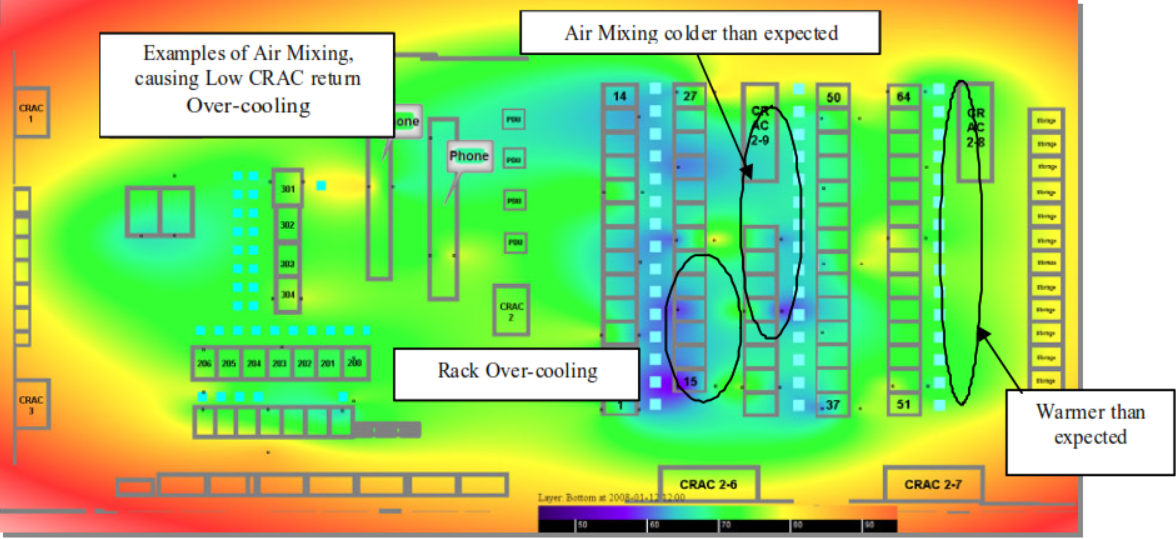
Air mixing is shown in a heat map. From this observation, Leaks in the floor, missing pads, misplaced tiles, air swirls above and to the side, and holes that cause hot air to leak into cold passages and vice versa can be identified. identify. In cold aisles, this has the effect of increasing the overall average temperature, reducing the overall efficiency of the cooling system because cold air is being used to cool the air from the hot aisle. In addition, this also makes the rack easily overheated.
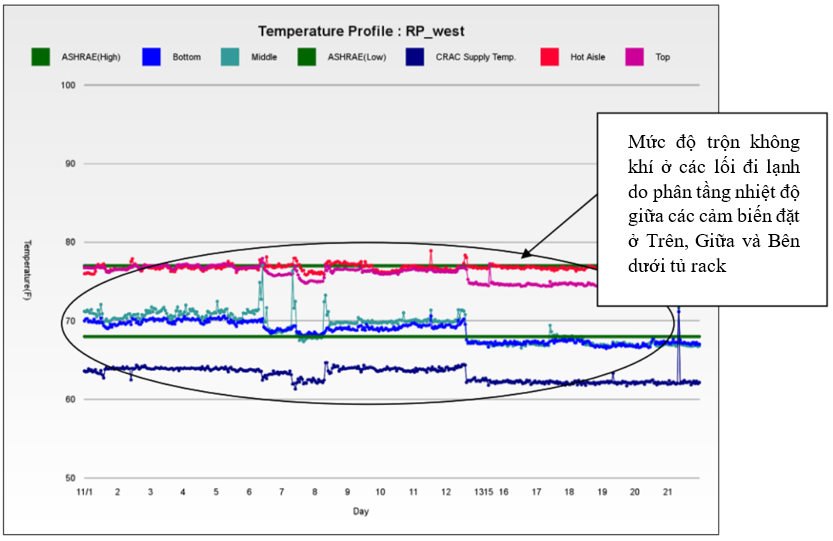
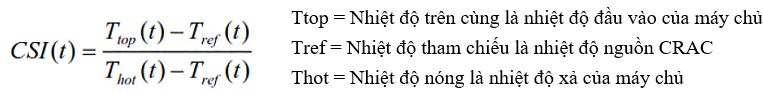
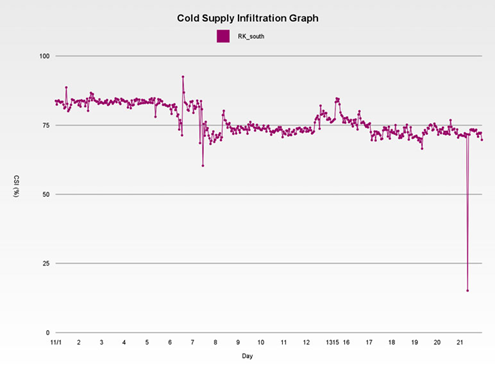
A temperature sensor is also installed on top of the Rack cabinet to compare the cabinet's inlet air temperature sensor and the CRAC's supply air temperature to quantify the level of hot air intrusion into the entrance. Cooling for each Rack cabinet and each Rack row. One type of measurement, called the Cold Supply Infiltration Index (CSI) , provides an index of air mixing in aisles, zones , and the entire data center. The CSI indicates cold aisle inlet air rise due to temperature rise on the servers that have mixed with the inlet air, before the air enters the server.
The CSI index at time t is calculated according to the following formula:
The graph below shows an example of heat distribution and the corresponding CSI index for a specific Rack. The CSI index shows that more than 50% of the total heat is absorbed in the main passage, indicating a high degree of air mixing.
 To be able to compare the data center infrastructure with existing IT capacity, the Power Usage Effectiveness (PUE) ratio was calculated as follows:
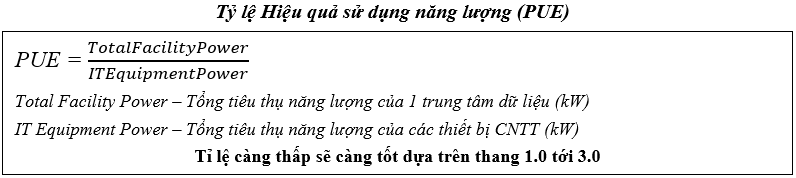
In the August 2007 EPA study (Report to the U.S. Congress on Server and Data Center Energy Efficiency Public Law No. 109-431; U.S. Environmental Protection Agency's ENERGY STAR Program) on energy usage of data centers, a PUE ratio of 2.0 is considered average across all data centers in the United States; based on sampling at Lawrence Berkeley National Laboratory data centers, however PUE rates may vary between specific data centers depending on the configuration and efficiency of the underlying equipment infrastructure, time of year and local climate.
Along with humidity sensors on each rack , Data Centers can scale the minimum and maximum acceptable RH% (Relative Humidity Percentage) to allow for additional energy savings and recovery. existing space and additional power resources for data center development.
A statistical study result of a Data Center also shows that: Based on an estimated annual savings of 300,160 kWh and 580 lbs/CO2 per MWh, it is possible to reduce carbon emissions for energy generation. down to 174,093 lbs CO2
Quantitative results will help answer the questions:
- Are the cooling systems currently installed adequate to meet the current load and to what extent can the new storage capacity be accommodated?
- The opportunity to optimize cooling through addressing airflow issues can be addressed by proposed measures such as: installing channeling materials, shielding open areas, raising and lowering heights, …
- Optimal on-off schedule for cooling equipment,...
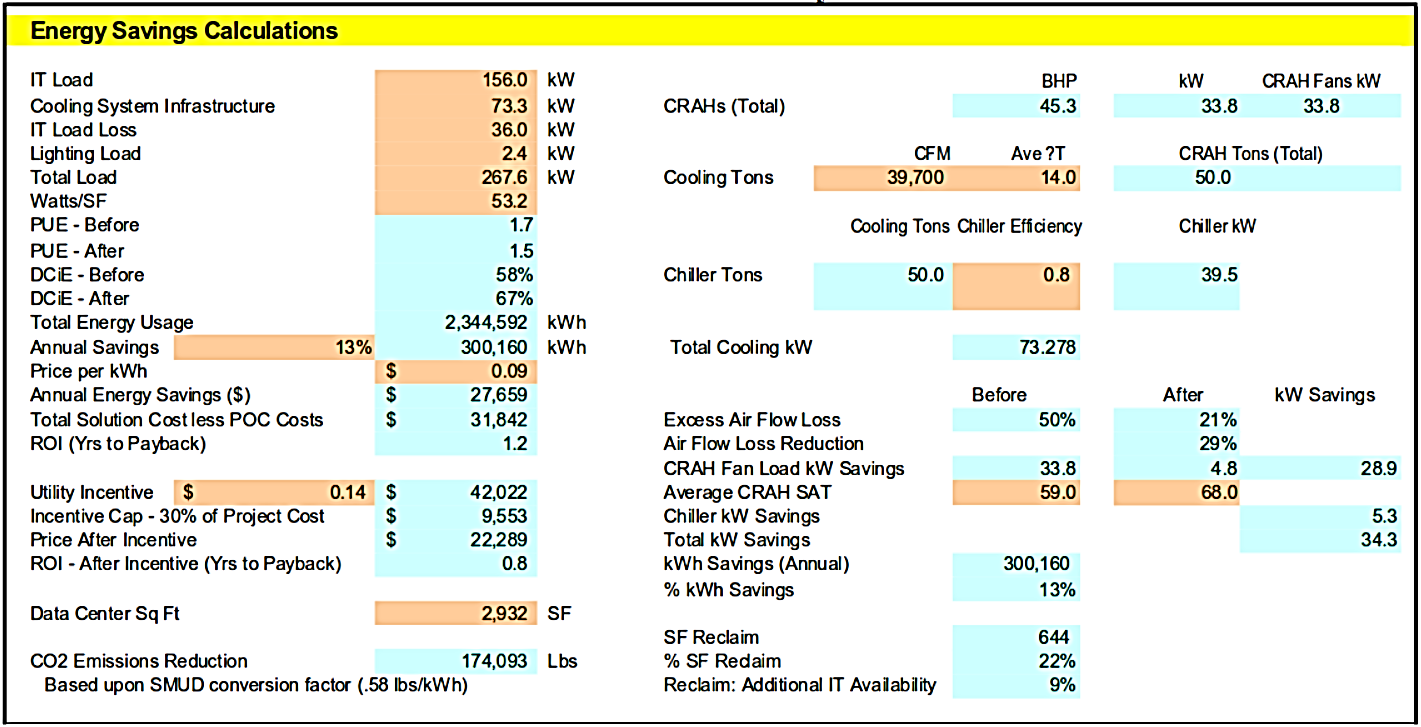 Example of ROI analysis in energy saving calculations at a sample facility (data center)

These results are used to evaluate, compare, and compare with promulgated general standards and norms and are the basis for making assessments, consulting, and finding actions to improve performance.
The above example is a typical model for deploying a sensor system to establish an effective Management and Monitoring system that meets ISO 50001 standards. The results it produces have the effect of providing practical solutions. To improve and enhance energy use efficiency, is also the goal that the ISO 50001 system mentions about Energy Management System, this is also the necessary purpose for every organization when building a system. energy management...
Table of contents of sections:
Energy Performance Monitoring - Introduction
Energy Performance Monitoring - P2 - Monitoring System
Energy performance monitoring - P3 - Methods
Next part: Energy performance monitoring - P4 - System operation